When you contribute to your super, the money is invested for you. Investment markets go through cycles, which means they will go through ups and downs.
Understanding how market cycles work can help you understand why your super balance sometimes goes down and why it’s important not to panic but instead stay focused on the long-term.
You super account balance can go up and down – and that’s normal. Here’s why: your super is invested in the market and investment markets, like shares and property, can go up or down. One reason your super balance may fluctuate is because it may follow the performance of the markets in which it is invested.
It’s natural to feel a bit uneasy when you see your super balance has fallen but by nature, investment markets will move through cycles which include ups, downs, and even sideways trends. Typically, no one knows how long a trend will last. Shares can go up or down depending on what’s happening in the world, however, while past performance is not a reliable indicator of future performance, we know that historically, share markets tend to rise over the long term.1
Bull and bear markets
The rambunctious, go-getting bull, or the grumpy, hibernating bear: these animals perfectly describe the key trends in an ever-moving marketplace.
- A ‘bull market’ means a positive market trend. The generally accepted definition is when a market index (like the S&P/ASX 2002) rises by at least 20% from recent lows.
- A ‘bear market’ means a negative market trend. The generally accepted definition is when an index falls by at least 20% from recent highs.
Some investors will even say they are ‘bullish’ (positive) or ‘bearish’ (negative) on a certain investment or on the prospects of certain investment markets e.g. shares or bonds.
Examples of recent bull and bear markets:
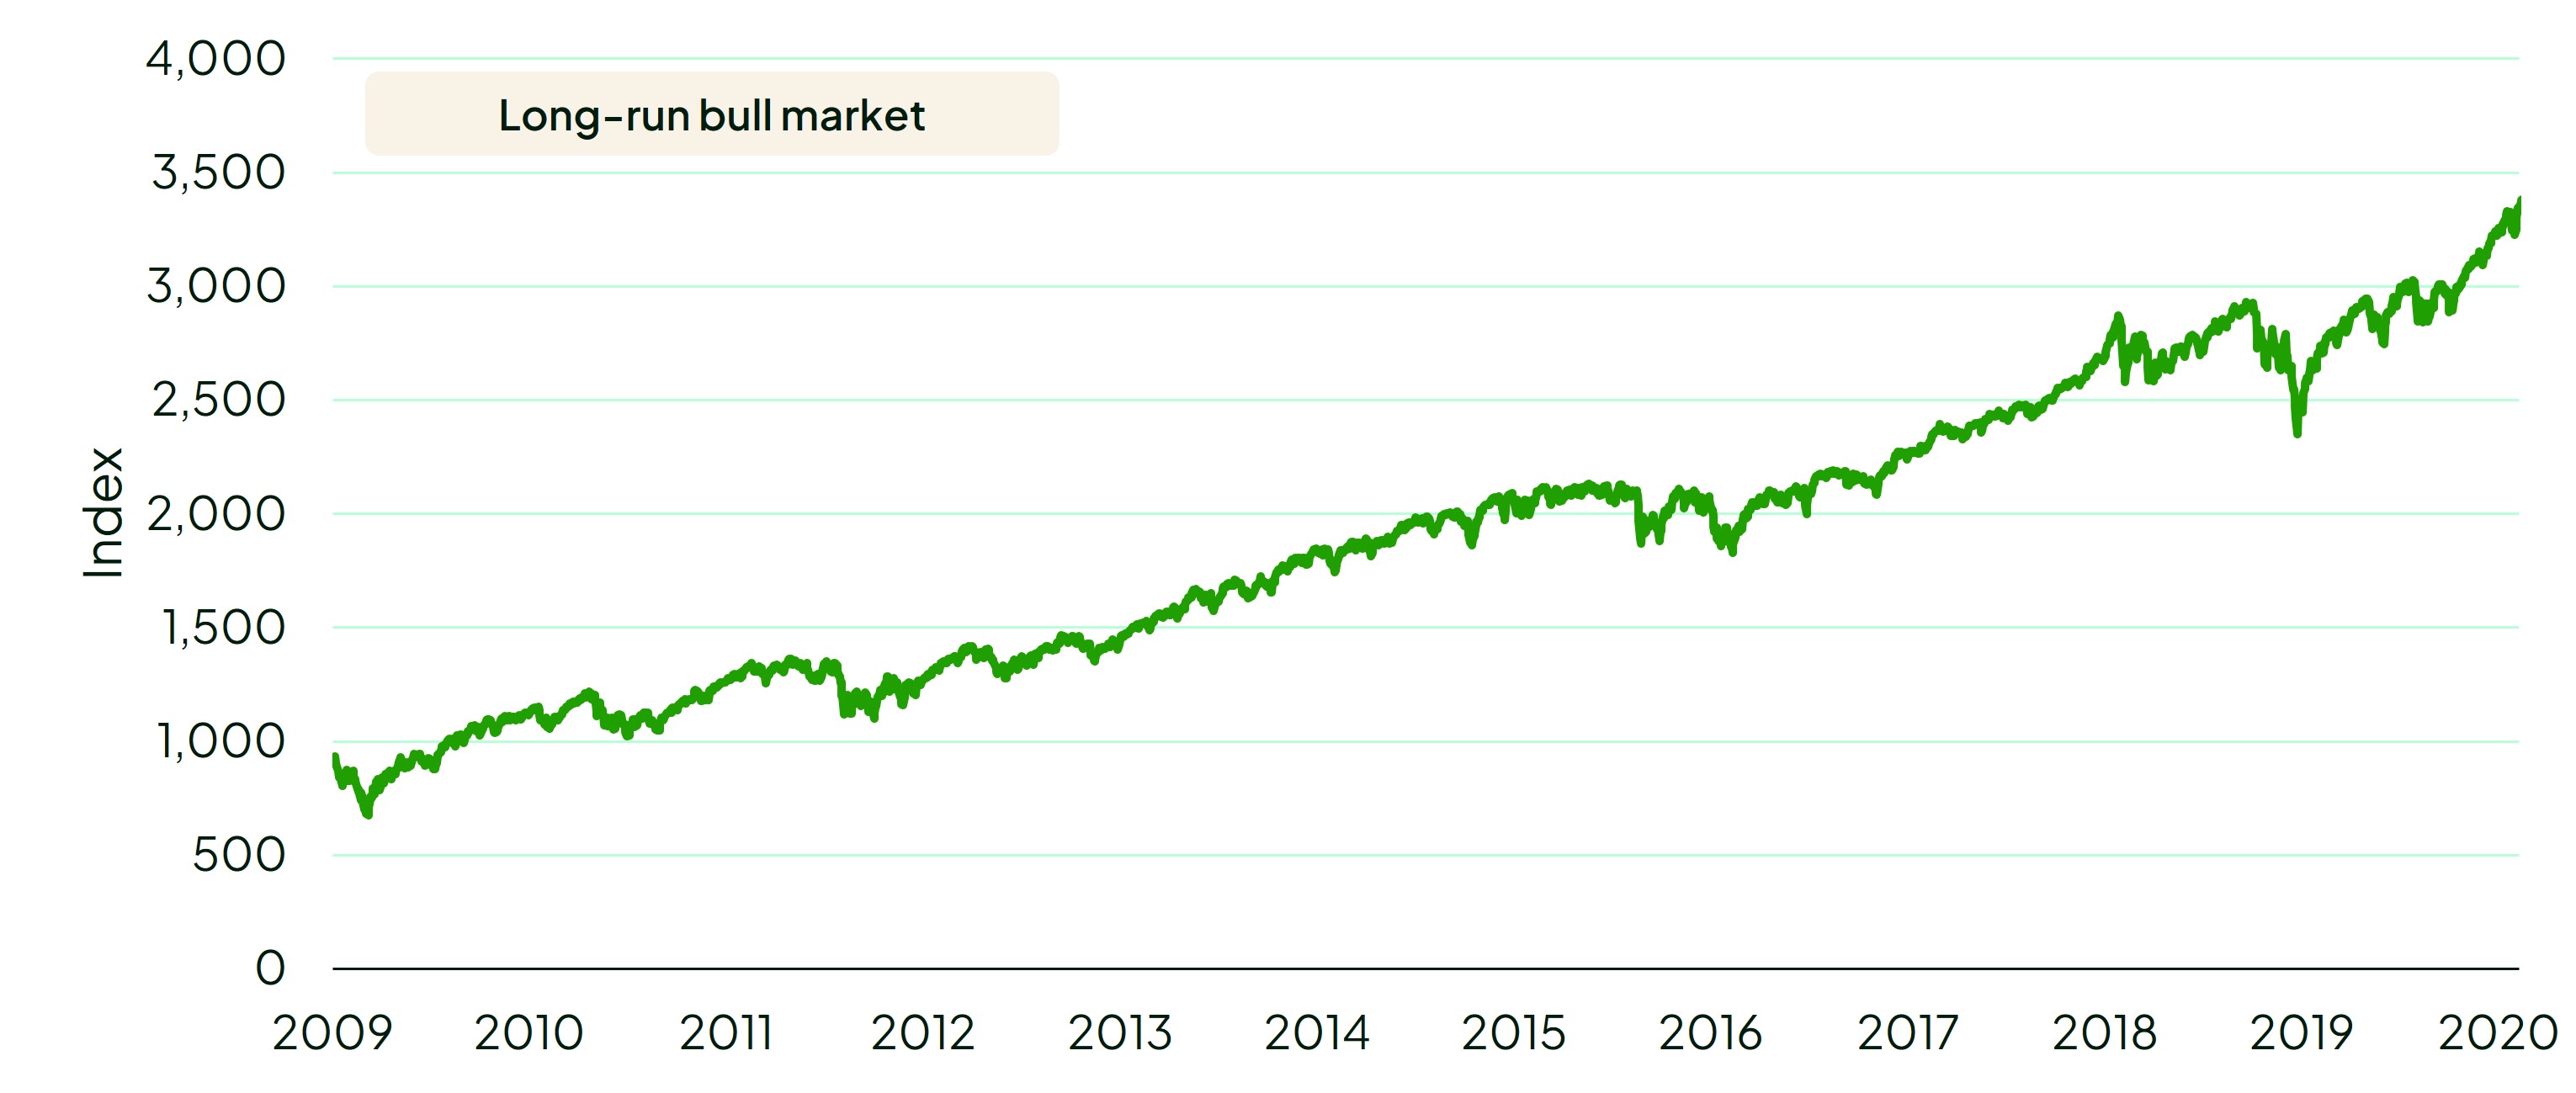
- Bull market: In the 2010s, the S&P 5003 stock market index experienced a bull market when it rose from the ashes of the ‘global financial crisis’ or GFC (just when many had given up hope) to record a decade long rally from an index level of 720 to 3,385. It was stopped only by the pandemic in early 2020. The equivalent Australian index, the S&P/ASX 200 experienced a similar but smaller bull market over the same timeframe.
S&P 500: A 2010s bull market
Source: Bloomberg, data to February 2020. Past performance is not a reliable indicator of future performance.
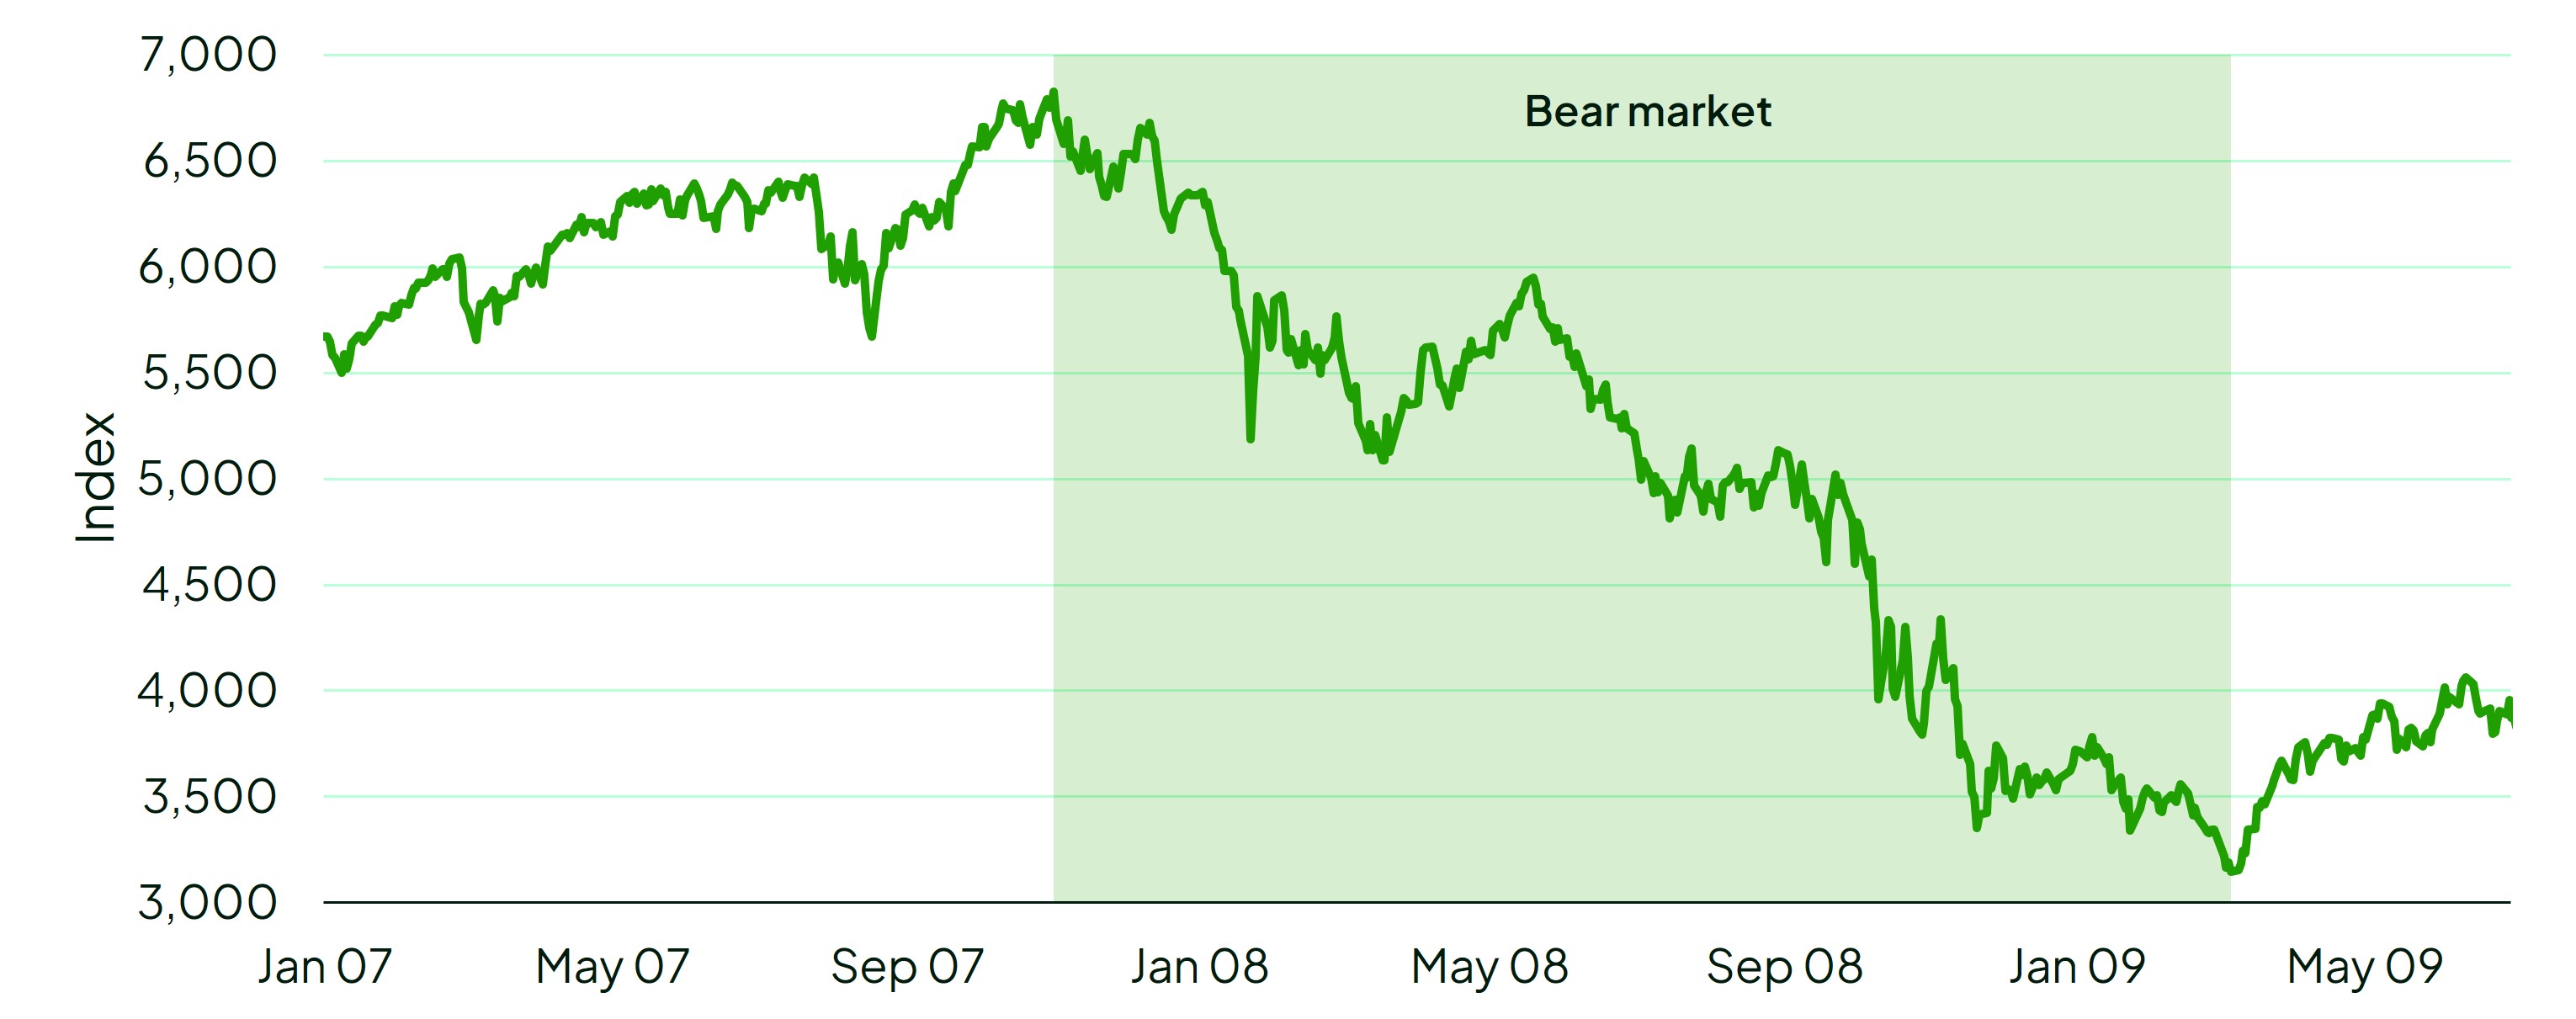
- Bear market: Between November 2007 and March 2009 – the S&P/ASX 200 declined by 54%. This bear market is better known as the 'global financial crisis’ or GFC (many of the most well-known bear markets and share market crashes have names: think ‘Black Monday’ of 1987, or the ‘Dot-com bubble’ of 2000-2002
S&P/ASX 200: The GFC bear market from November 2007 to March 2009
Source: Bloomberg, June 2009. Past performance is not a reliable indicator of future performance.
How market volatility affects your super
You may have noticed your account balance recently fluctuate due to market changes. Learn more about how market volatility affects your super.
What causes these market cycles?
Bull markets can be driven by investors who are eager to buy and as a result, they are bidding prices up. Bear markets can be driven by investors who are eager to sell. The causes of these mass changes in sentiment are complex and often up for debate, even after the cycle has passed. These are a few examples of factors that historically have influenced markets to move:
- FOMO (or fear of missing out) - Investors see markets going up and they don’t want to miss out.
- Fear of losing money - Investors see markets falling and they want to get out before it drops any further.
- Economic activity - This may influence market performance. For example, an economic slowdown or recession can reduce company profits, thereby reducing the amount of money people have to invest. People may also feel less confident about investing. In combination, these factors can drive prices down. Conversely, an economic boom can boost markets. Like all unpredictable beasts though, not all bear markets are accompanied by economic recessions and not all bull markets are linked to economic booms.
- Surprising news events - These can cause frenzied selling or buying. For example, in March 2020 there was a frantic sell-off in response to the COVID-19 pandemic. Other examples of news that could impact markets include a surprise interest rate cut, the introduction of new technology, natural disasters, and geopolitical events such as a war.
How we manage these risks
Different asset types will react differently to the factors that drive the market cycle. For example, it is a commonly held investment belief that riskier assets like shares tend to outperform in bull markets while more conservative investments like bonds tend to perform better in bear markets.
One of the potential benefits of Rest’s diversified options is that investments are spread across a range of different asset classes. For example, if you’re invested in the Rest's MySuper option, Growth, your super will invested in a range of assets which can include:
These asset classes are also further diversified across different:
- investment managers
- industry sectors
- countries
By diversifying, we aim to reduce the risks of falling markets for your super. If shares and/or property markets fall, being invested in more defensive asset classes like bonds, infrastructure and/or cash may offset losses. Similarly, if Australian shares fall, it’s possible that shares in other regions will fare better.
In a nutshell, some assets perform better than others at different times, and diversifying across a range of asset types is one way to potentially smooth out returns over time.
Know what to expect from your bulls and bears
Bear markets can be a normal part of market cycles, but even so, falling markets can feel painful. It can be very difficult to watch your investments or your super fall for months, or even years. That’s why it is important to remember:
- Markets move in cycles: the market falling is not necessarily a reason to panic.
- While past performance is not a reliable indicator of future performance, historically traditional investment markets like bonds and shares tend to perform well over the long-term4.
- For most Rest members, super is a long-term investment.
Having realistic expectations, a plan, and diversified investments are some ways to help you better manage the ups and the downs of the market to achieve long-term success.
1. As evidenced by the performance of standard equity indices over 10 years (data as of 31 December 2025) including the S&P 500 Index +14.82% p.a and S&P/ASX 300 Accumulation Index +9.32% p.a.
2. The S&P/ASX 200 is a share market index which tracks the 200 largest listed Australian companies. It is often used as a benchmark to measure the combined performance of Australian shares.
3. The S&P 500 is a share market index which tracks the 500 largest listed American companies. It is often used as a benchmark to measure the combined performance of American shares.
4. As evidenced by the performance of standard equity and bond indices over 10 years (data as of 31 December 2025): S&P 500 Index +14.82% p.a, S&P/ASX 300 Accumulation Index +9.32% p.a, Bloomberg AusBond Composite Index +2.03% p.a and Bloomberg Global Aggregate Index (AUD Hedged) +1.95% p.a.